ComPlots - visualization for NASA ER-2 and WB-57 data files
ComPlots is designed to aid in visualization of the NASA ER-2, WB-57
and balloon borne instruments data. NASA specified the data to be placed
in very strange formats, rooting back to the times when storage space savings
from not storing decimal points were important. Some data formats are so
strange, I doubt even the designers use them.
ComPlots has import routines only for a few NASA formats. It is fairly
easy to integrate new import procedures to the existing ComPlots framework.
ComPlots relies on a table with mission dates listings for determining
the flight dates. This table needs to be created manually. A benefit of
this is that one can easily add a custom date list that is being reused
(say, northbound flights only). The drawback... well, the table needs to
be made manually.
ComPlots uses IDL direct graphics by default. Thus, it is possible
to make ComPlots overplot to multiple graphics windows, which is especially
easy when using something like smart_w. Additionally,
ComPlots allows to use the Display routine, which in turn provides built-in
zooming, labeling, legend, plot deletion and region of interest capabilities
(see Display for details).
ComPlots allows to create 2D and 3D visualizations, as well as contour
plots.
Another version of ComPlots (written in IDL object syntax) is also
available, but it is not quite complete. Lack of features in IDL's Contour
object is the main obstacle in creating modular, object-based ComPlots
that would be totally equivalent to direct graphics version.
It is possible to use DOG (Direct Object Graphics)
system to use as graphics output for ComPlots, but no built-in facilities
are provided for that at this moment. DOG is not well documented at this
time. However, it is simple and can be read in IDL with little effort.
Below is ComPlots user help file. It is not as detailed as HATSchrom's
but ComPlots is not nearly as complex, either. Fifteen minutes of clicking
around it and a user should have a good grasp on the basics.
This Help file contains basic guidelines for using ComPlots.
ComPlots can be started by typing "complots" at the IDL command line. At
startup, complots will show a dialog box where you can pick a data file
to visualize. Choosing a file, as well as specifying an existing file name
on the command line as follows: "complots, FileNameWithPath", will start
ComPlots in "Display" Mode. Pressing "Cancel" button in the dialog box
causes ComPlots to start in "New DataFile / File Loading" Mode (see below
for details). The same "New DataFile / File Loading" Mode can be achieved
from the startup by entering "complots, /new" on the IDL command line.
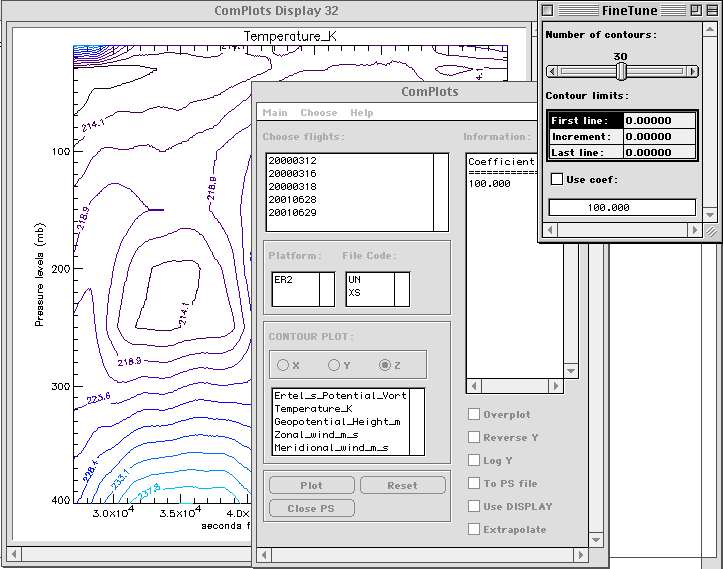
Parts of ComPlots GUI.
Menu Bar
"File" menu contains:
a) choices for the Mode in which ComPlots operate ("File
Loading" and
"Plot", or "Display", Modes).
b) Exit choice that allows to gracefully leave ComPlots. Using operating
system window kill function will also exit ComPlots gracefully. See MEMORY
NOTE below for a crash warning.
"Choose" menu contains:
a) "By Mission" and "By Date" choices, allowing to pick flights for
display or loading either by individual date or by mission name.
"Help" menu contains:
a) "Topics" choice is this operation information.
b) "About" choice which displays contact information, current ComPlots
Mode and brief release information.
Main window, Display Mode:
"Choose flights:"
This control allows to select one or more flights, deployments or missions
from the displayed list. The list must be present in the loaded data file
or exist as a separate "FlighLists.txt" file in the working directory.
The list file for ASHOE/MAESA, STRAT and POLARIS is provided with ComPlots.
Edit the file to add other missions. This control is mouse-sensitive, i.e.
Information panel displays the dates chosen for loading or plotting when
the mouse cursor enters the control area.
"Platform:"
In the flight database, Platform is determined by the exchange file
extension. Platform may be ER-2 or OMS.
"Instrument:"
This is the exchange file's first two letters which identify the creator
of the file.
"Display:"
This section is for choosing the data to display. It only becomes available
after Platform and Instrument are chosen. Plotting is available in up to
3 dimensions, i.e. simple variable plot, correlation plot or 3D correlation
plot.
"X, Y, Z"
By pressing these buttons, a choice of variable common for the chosen
datasets will become available. You can choose subsequently variable(s)
for Y axis (after this, pressing "Plot" button will display a simple variable(s)
plot), X axis and Z axis. Note that you can choose multiple variables for
your ordinate axis. Thus, if you chose multiple Y variables and then chose
a Z variable, your Y variables will reset and you will need to choose a
single Y variable. These controls are mouse-sensitive, i.e. Information
panel displays the variables chosen for plotting when the mouse cursor
enters the controls area.
"Plot"
This button performs data interpolation and outputs the results on
the display. Note that the interpolation is performed based on the variable
with the lowest sampling frequency.
"PS File"
This button plots the same plot as "Plot" button but into a postscript
file called "idl.ps". This is useful for editing plots and future use in
documents, or printing.
"Information:"
Contains runtime and mode information that is useful for data analyses.
Information about the database, plotting status and missing data is presented
in this window. That information is not interactive, i.e. not editable
and produces no effect when clicked with a mouse.
Main Window, File Loading Mode.
ComPlots is capable to read NASA exchange file formats. At this time, the
following File Format Indices (FFI) are supported:
1001
2010
Other FFIs will be added upon request.
Loading process reads exchange files and places their contents into
memory. A repeated need for the data is expected, so ComPlots will attempt
to save the loaded database in a binary file for future use. It is advantageous
because binary files are loaded much faster than ASCII exchange files.
If you load more exchange files from an existing data file, new data
will be added to that file. If you started a new database, you will be
prompted for a filename before saving binary file.
"Choose flights:"
The functioning of this control are identical to those in Display Mode.
"Platform:"
This control is not used in Loading Mode.
"Instrument:"
This control will contain the list of instruments available for loading.
Note that this list is comprised of the unique first two characters of
the file names (displayed in the Information panel) existing in the current
directory. Therefore, if you are in a wrong directory, then loading will
of course fail.
"Ch Dir"
This control allows to choose the directory that contains exchange
files.
"Load"
Initiates loading process.
MEMORY NOTE:
ComPlots rely upon the system of pointers to heap memory variables to store
and analyze different length data records efficiently. When ComPlots exit,
it cleans up the heap memory from all data it used. However, if ComPlots
crashes, a large volume of data will remain in heap memory because all
pointers handled by ComPlots will be lost. It is advisable to call HEAP_GC
function immediately should ComPlots crash to avoid memory shortage.